<pie-chart> and <progress-circle> examples
Load
<script src="https://pie-meister.github.io/PieMeister.min.js"></script>
            OR
<script src="https://pie-meister.github.io/PieMeister-with-Progress.min.js"></script>
Use
Then ALL HTML required to display a pie-chart is:
The <pie-chart> Web Component processes all innerHTML <slice> elements and creates an SVG
Element in shadowDOM
The
Get 6 colors free
The SVG has a default 1000 x 1000 units viewBox
If a custom label is declared, the word '$size' is replaced.
An empty <slice> auto-completes a percentage pie
labels can be pulled with
See F12 console: There are plenty of extra attributes available to play with
The SVG <circle>, <text> and <style> elements become part of the created <svg> element
As the <pie-chart> element copies all SVG, you can apply all SVG patterns,masks,animations you can find online.
Note: in SVG, styles have higher Specificity than SVG element attributes
Thus an inline style is used to override the stroke color.
The
If you know SVG: all <slice> attributes are copied to the SVG <path> element
And/or color a slice
The slice
<pie-chart> Challenge: Radiation
Now knowing <pie-chart> syntax; how would you create this?
- How many slices do you see?
- How many circles do you see?
- Hint: The first slice starts at the top
Progress Circle
Use SVG
See the <progress-circle> below for a advanced version
Recreating Google Analytics multiple percentages
By adding extra slices, that always start at
and clever
CSS translating the label locations
this chart with 4 percentages can be created.
The <progress-circle> Web Component (below) creates this <pie-chart> code in 6 HTML lines
<progress-circle> Web Component
Is built on top of the PieMeister Base Class and converts innerHTML to <pie-chart> notation
The previous 30 lines HTML/CSS code can now be written as:
A single <progress-circle> Element
can be configured with Attributes:
- width
- fill
- stroke
- color
- edge
- document size=360 , or set fixed pathLength=100
- Document SVG <tspan>
- Document gap
- Document slice.point( x , y , z)
- Fix .createSlice
- (contrary to HTML) <style> definitions overrule attributes on SVG elements
- <circle /> self-closing tags do not work
-
A <slice> is converted to a SVG <path>, it can only contain SVG Elements not HTML elements
<slize size="10"><span> HTML here breaks the SVG </span></slice>
- Fun fact:
does not use any Pi calculations!
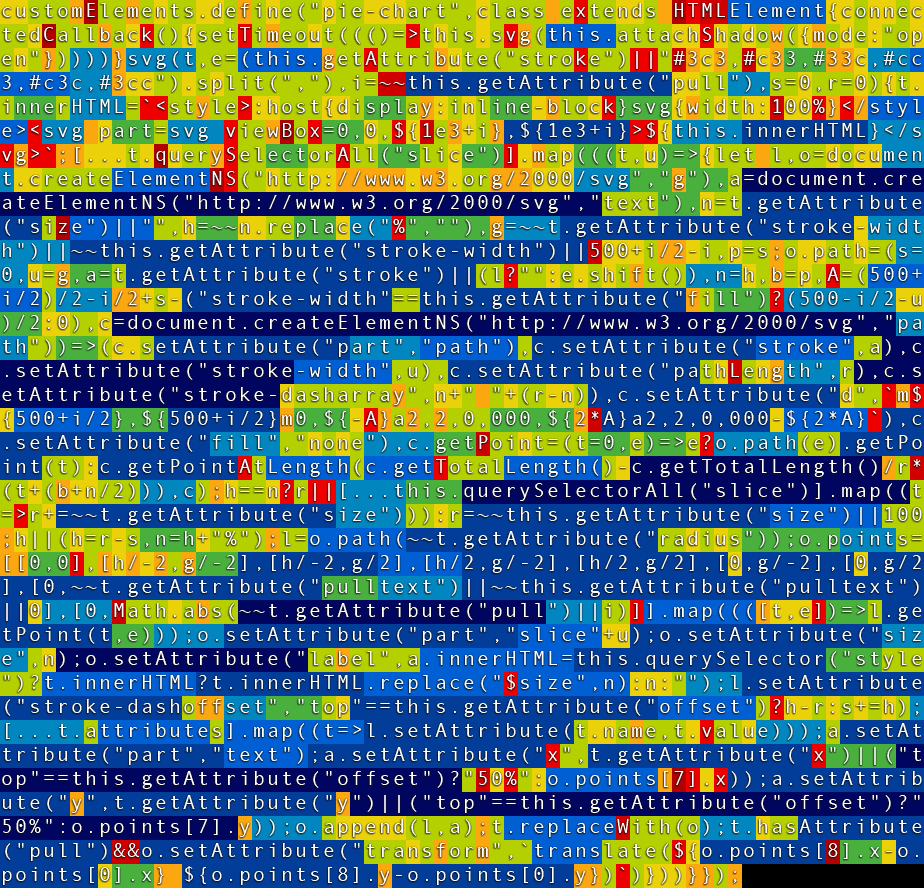
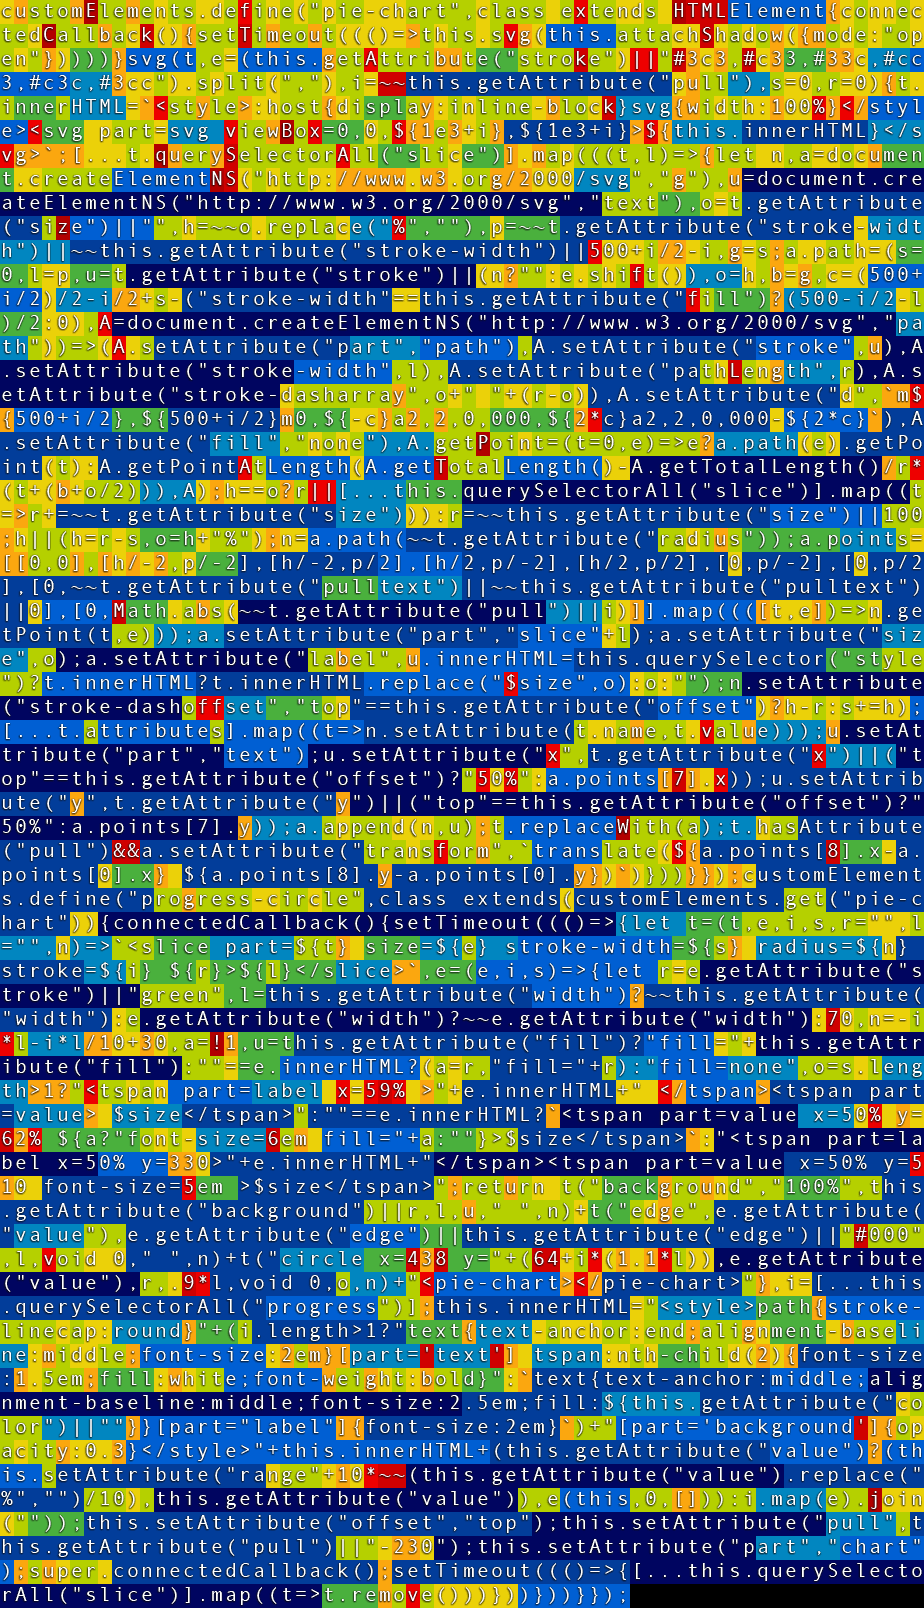
PieMeister code is an optimized balance between function, size and performance
Blue is best compression, Red is worst compression
Can you squeeze out more bytes?
PieMeister:

PieMeister with Progress:

Maybe create multiple SVGs, for slices and labels, and stack them, like done in the ChessMeister Chessboard experiment